
The tables and charts below show, with a certain continuity from the Napoleonic period to the aftermath of the Second World War, how emigration was a family survival strategy in the Municipality of Bagnone. In the eighteenth century and the early decades of the nineteenth, it was mainly men between twenty and thirty years of age who left for the Barsana, Corsica, and the Maremma during the winter season, to work in earth-moving and land-reclamation. Women, who stayed at home, could — besides managing the household and children — become a source of substantial income during the period of their lives when they were able to breastfeed, through wet-nursing. According to the register of the Ospizio dei Gettatelli (Foundling Hospital) of Pontremoli, in 1868 the institution housed: 28 children from Pontremoli and 25 from Bagnone, 3 from Mulazzo, 4 from Villafranca, and 2 from Zeri¹ — a figure indicating that Bagnone, compared with the provincial capital, was the area with the highest rate of child abandonment and the widest spread of wet-nursing. Wet-nursing was a widespread practice among the “barsane,” who exchanged their own children with one another to be nursed during their periods away selling door to door. The tables show that female emigration already began to rise from the second half of the nineteenth century: in 1857, the Municipality of Bagnone shows the highest female incidence, with the age group most involved in emigration ranging between twenty and fifty years, and the largest peaks between twenty and thirty. From the early twentieth century onward, destinations became more varied: within emigration abroad, although migration within continental Europe prevailed, a migratory flow toward the United States can be observed, particularly toward California — a fairly stable flow, involving a number of family groups.
This model of Apennine mobility fits into a long-term European migratory geography: the Dutch historian Jan Lucassen, in Migrant Labour in Europe, 1600–1900 (1987)², identifies seven major migrant-labour systems in Europe, from the North Sea to the Paris basin, from the Provence–Languedoc–Catalonia axis to Piedmont, up to central Italy united with Corsica. It is within this last system that the Tuscan Apennines are situated, and with them the Lunigiana: a confirmation that the migrations from the Lunigiana were not a peripheral phenomenon, but part of a labour-mobility network recognized at a continental level.
¹ DADÀ, Adriana, Dalla Lunigiana alla “Barsana.” Il processo di trasformazione da lavoratori agricoli stagionali in venditori ambulanti specializzati, SIDES, “Bollettino di Demografia Storica,” 1993, no. 19.
² LUCASSEN, Jan, Migrant Labour in Europe, 1600–1900: The Drift to the North Sea, Routledge Kegan & Paul, 1987.
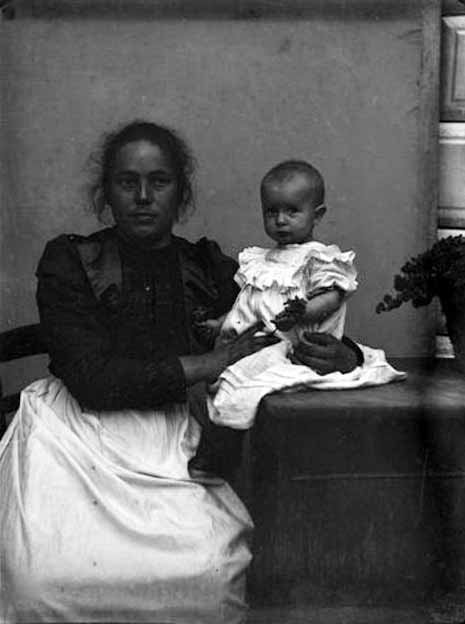
Fonte — Source: DADÀ, Adriana, Le Barsane. Venditrici ambulanti dalla Toscana al Nord Italia, Morgana Edizioni, Firenze, 2008, p. 8.
Tables and charts
Tab. 1 — Emigrants from Bagnone in 1812, by age
| Age | Emigrants | % |
|---|---|---|
| 10-15 | 4 | 3,8 |
| 16-20 | 13 | 12,4 |
| 21-25 | 5 | 4,8 |
| 26-30 | 26 | 24,7 |
| 31-35 | 11 | 10,4 |
| 36-40 | 12 | 11,5 |
| 41-45 | 12 | 11,5 |
| 46-50 | 7 | 6,6 |
| 51-55 | 5 | 4,8 |
| 56-60 | 4 | 3,8 |
| 61+ | 6 | 5,7 |
| TOTALE | 105 | 100,0 |
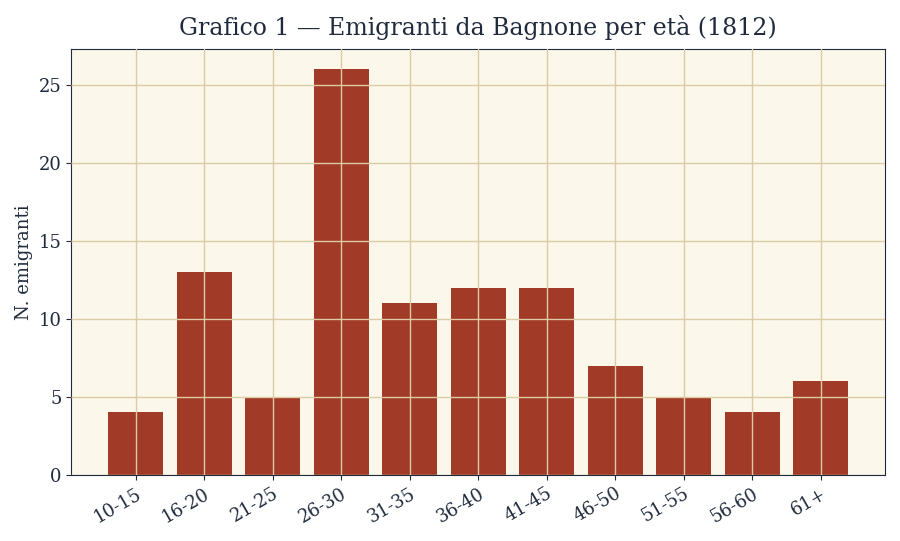
• Tab. 1 — Emigrants from Bagnone in 1812, by age. Source: compiled from data in the passport records held at the State Archive of Parma (ASP).
Tab. 2 — Inhabitants and emigrants from Bagnone in 1849, by age group and sex
| Age | Inhabitants M | Inhabitants F | Emigrants M | Emigrants F |
|---|---|---|---|---|
| 0-10 | 84 | 86 | 18 | 11 |
| 11-20 | 63 | 66 | 33 | 13 |
| 21-30 | 62 | 56 | 45 | 15 |
| 31-40 | 27 | 33 | 15 | 3 |
| 41-50 | 33 | 30 | 19 | 11 |
| 51-60 | 20 | 21 | 7 | 5 |
| 61-70 | 11 | 10 | 2 | 1 |
| 70+ | 7 | 5 | 1 | 0 |
| TOTALE | 307 | 308 | 139 | 60 |
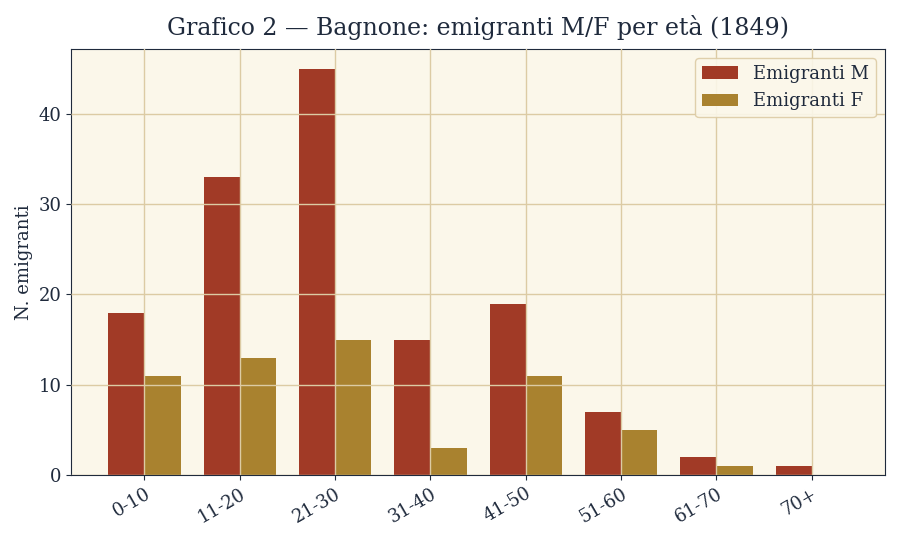
• Tab. 2 — Inhabitants and emigrants from Bagnone in 1849, by age group and sex. Source: from data in the register held at the State Archive of Parma (ASPa), Interior Office, folder 476. Overall migration rate for 1849: M 45.2% · F 19.4% · M+F 32.3% (out of 615 total inhabitants, 199 total emigrants).
Tab. 3 — Inhabitants and emigrants holding free passports from Bagnone, 1849–57
| Year | Inhabitants | Emigrants |
|---|---|---|
| 1849 | 4916 | 305 |
| 1850 | 5417 | 850 |
| 1851 | 5525 | 824 |
| 1852 | 5612 | 930 |
| 1853 | 5742 | 921 |
| 1854 | 5810 | 955 |
| 1855 | 5804 | 963 |
| 1856 | 5794 | 1267 |
| 1857 | 5752 | 1093 |
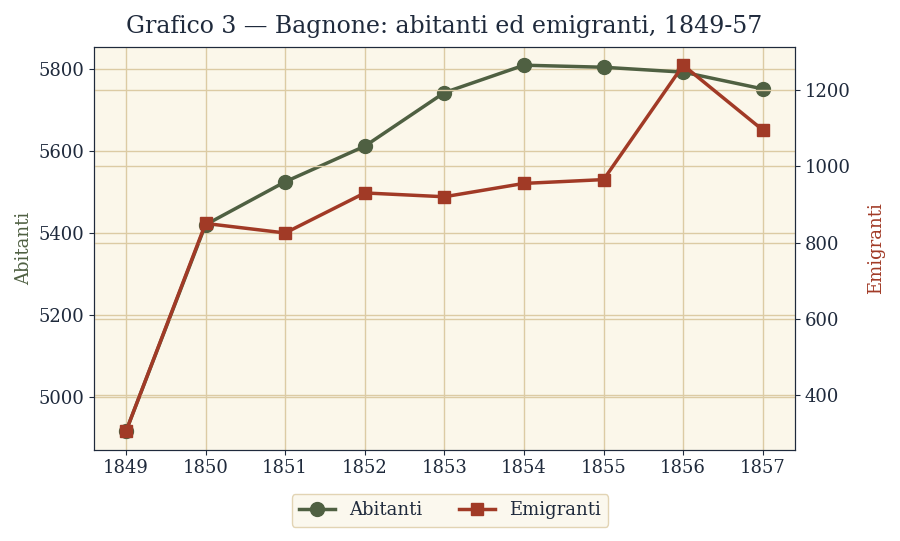
• Tab. 3 — Inhabitants and emigrants holding free passports from Bagnone, 1849–57. Source: compiled from data held at the ASP, Prefecture of the Parma Lunigiana, Censuses 1849–59, file 1; Municipal Archive of Bagnone (ACB), 1857 Census.
Tab. 5 — Inhabitants and emigrants holding free passports from Bagnone, by sex, 1856–1857
| Year | Inhabitants M | Inhabitants F | Inhabitants M+F | Emigrants M | Emigrants F | Emigrants M+F |
|---|---|---|---|---|---|---|
| 1856 | 2910 | 2884 | 5794 | 1094 | 173 | 1267 |
| 1857 | 2904 | 2848 | 5752 | 920 | 173 | 1093 |
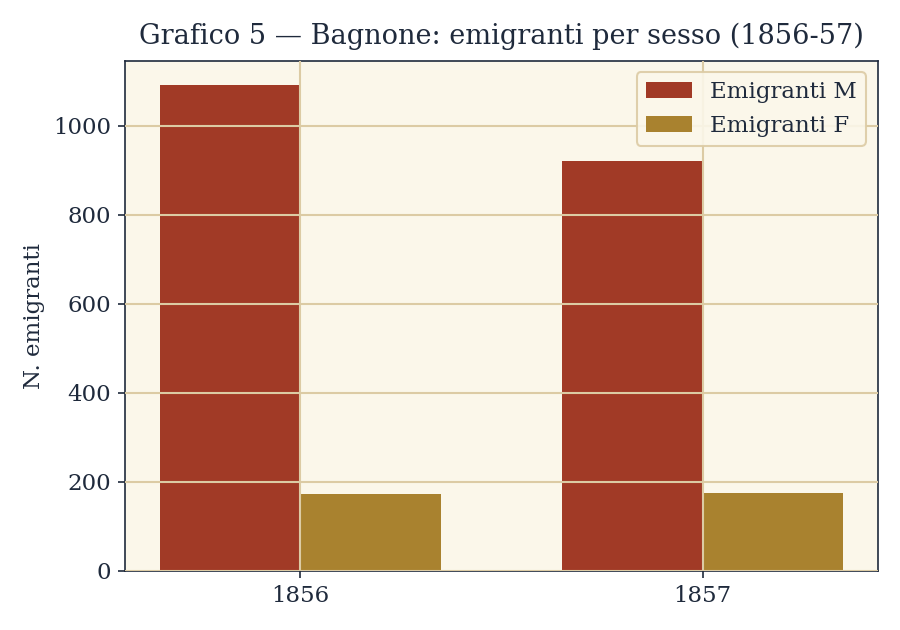
• Tab. 5 — Inhabitants and emigrants holding free passports from Bagnone, by sex. Source: compiled from data held at the ASP, ACB, folder 431 — Population statistics, 1845–60.
Tab. 6 — Inhabitants and emigrants from the hamlet of Pieve di Bagnone, 1856–1857
| Year | Inhabitants M | Inhabitants F | Inhabitants M+F | Emigrants M | Emigrants F | Emigrants M+F |
|---|---|---|---|---|---|---|
| 1856 | 328 | 302 | 630 | 153 | 117 | 270 |
| 1857 | 321 | 316 | 637 | 127 | 86 | 213 |
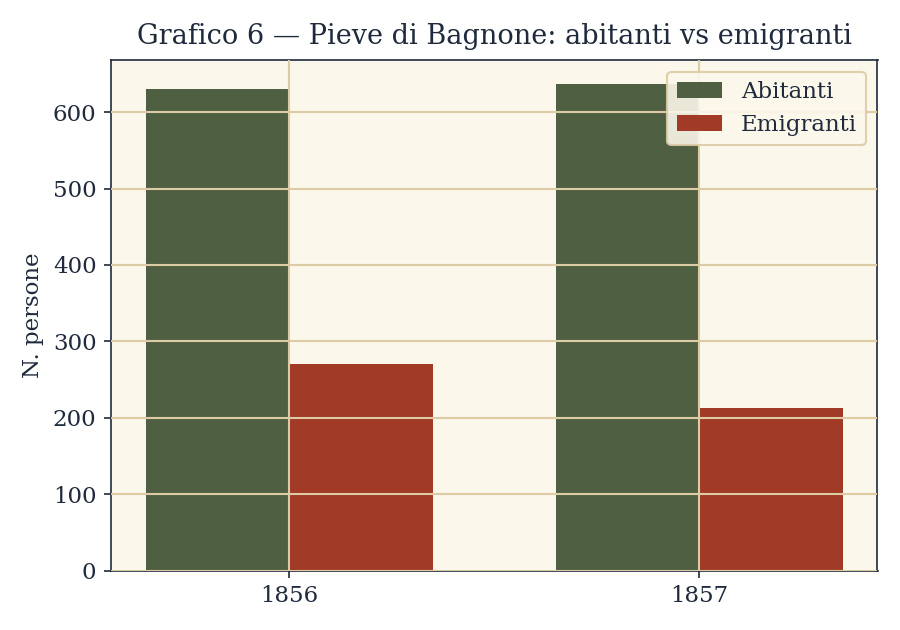
• Tab. 6 — Inhabitants and emigrants from the hamlet of Pieve di Bagnone. Source: compiled from data held at the ASP, ACB, folder 431 — Population statistics, 1845–60; 1857 Census.
Tab. 7 — Inhabitants and emigrants in the Parma Lunigiana, 1857
| Municipality | Inhabitants M | Inhabitants F | Inhabitants M+F | Emigrants M | Emigrants F | Emigrants M+F | Rate M % | Rate F % |
|---|---|---|---|---|---|---|---|---|
| Bagnone | 2904 | 2848 | 5752 | 920 | 173 | 1093 | 31,7 | 6,1 |
| Filattiera | 1121 | 1027 | 2193 | 90 | 4 | 94 | 8,0 | 0,3 |
| Mulazzo | 2175 | 2190 | 4365 | 658 | 16 | 674 | 30,3 | 0,7 |
| Pontremoli | 6033 | 5847 | 11880 | 632 | 18 | 650 | 10,4 | 0,3 |
| Villafranca | 1808 | 1664 | 3472 | 374 | 12 | 386 | 20,5 | 0,7 |
| Zeri | 1797 | 1765 | 3562 | 475 | 50 | 525 | 26,4 | 2,8 |
| Tot. provincia | 15838 | 15386 | 31224 | 3149 | 273 | 3422 | 19,1 | 1,8 |
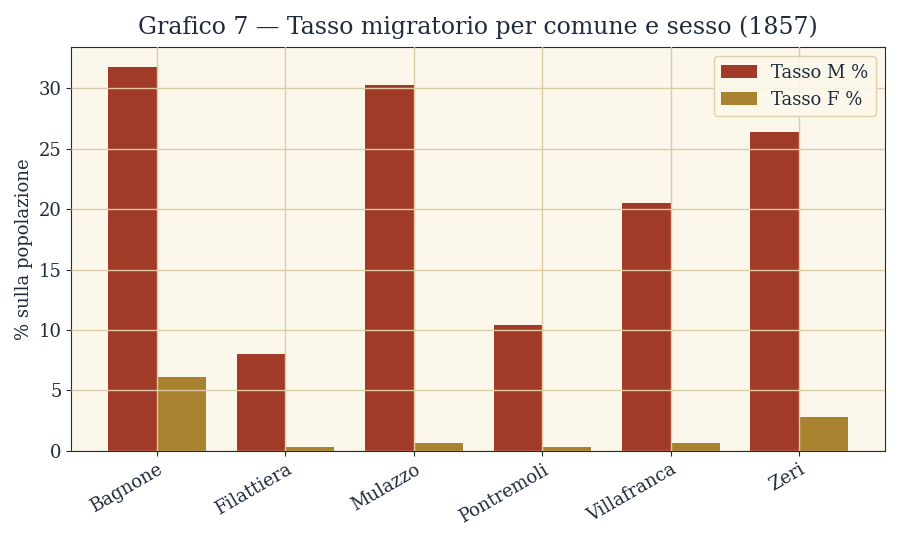
• Tab. 7 — Inhabitants and emigrants in the Parma Lunigiana. Source: reworked from data held at the State Archive of Parma, 1849–59, folder 125, file 59; 1857 Census, table II — Resident population by age and sex, Province of the Parma Lunigiana.
Tab. 8 — Inhabitants of the municipality of Filattiera and emigrants from certain hamlets, by age, 1858
| Age | Inhabitants | % of total | Emigrants | % of total |
|---|---|---|---|---|
| 0-10 | 634 | 26,5 | 0 | 0,0 |
| 11-20 | 453 | 19,0 | 5 | 6,8 |
| 21-30 | 401 | 16,7 | 29 | 39,8 |
| 31-40 | 272 | 11,3 | 16 | 21,9 |
| 41-50 | 192 | 8,0 | 14 | 19,2 |
| 51-60 | 178 | 7,4 | 4 | 5,5 |
| 61-70 | 194 | 8,7 | 5 | 6,8 |
| 71-80 | 54 | 2,3 | 0 | 0,0 |
| 81-90 | 6 | 0,2 | 0 | 0,0 |
| TOTALE | 2384 | 100,0 | 73 | 100,0 |
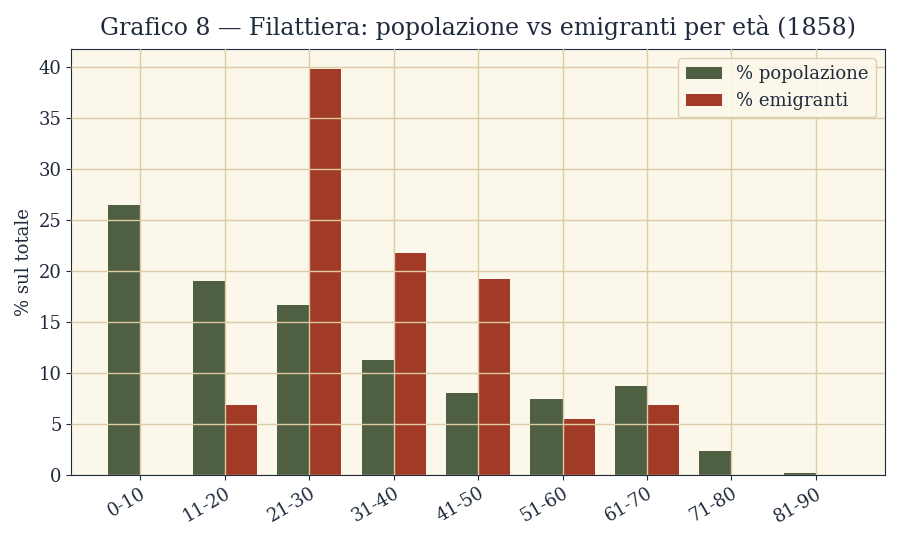
• Tab. 8 — Inhabitants of the municipality of Filattiera and emigrants from certain hamlets, by age. Source: compiled from data held at the Municipal Archive of Filattiera (ACF), 1857–58 Censuses, Population Registers.
Tab. 9 — Resident and present population of Bagnone at each census, 1861–1961
| Year | Resident pop. | Present pop. | Avg. annual change | Difference |
|---|---|---|---|---|
| 1861 | 5271 | 4789 | 0,0 | -482 |
| 1871 | 5750 | 5610 | +9,0 | -140 |
| 1881 | 6087 | 5565 | +15,9 | -522 |
| 1901 | 6867 | 6280 | +12,1 | -580 |
| 1911 | 7021 | 5927 | +2,2 | -1094 |
| 1921 | 7226 | 6822 | +2,3 | -404 |
| 1931 | 7108 | 6161 | -1,5 | -1047 |
| 1936 | 6660 | 6201 | -6,5 | -459 |
| 1951 | 6280 | 4930 | -6,0 | -1350 |
| 1961 | 4545 | 3125 | -38,1 | -1420 |
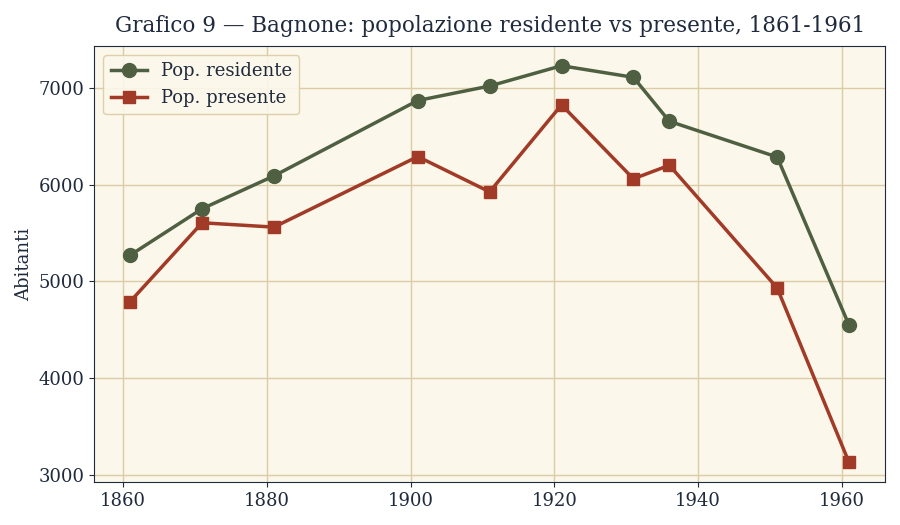
• Tab. 9 — Resident and present population of Bagnone at each census. Source: compiled from ISTAT census data — Present and resident population at the censuses from 1861 to 1961; Territorial districts, 1861–1961.
Tab. 12 — Changes of residence outside the province and to the “Barsana” area, 1932–1940
| Year | Total transfers | Of which to Barsana | % Barsana |
|---|---|---|---|
| 1932 | 97 | 30 | 30,9 |
| 1933 | 103 | 35 | 34,0 |
| 1934 | 497 | 422 | 84,9 |
| 1935 | 405 | 288 | 71,1 |
| 1936 | 190 | 130 | 68,4 |
| 1937 | 222 | 163 | 73,4 |
| 1938 | 187 | 106 | 56,7 |
| 1939 | 199 | 143 | 71,9 |
| 1940 | 161 | 106 | 65,8 |
| TOTALE | 2033 | 1481 | 65,9 |
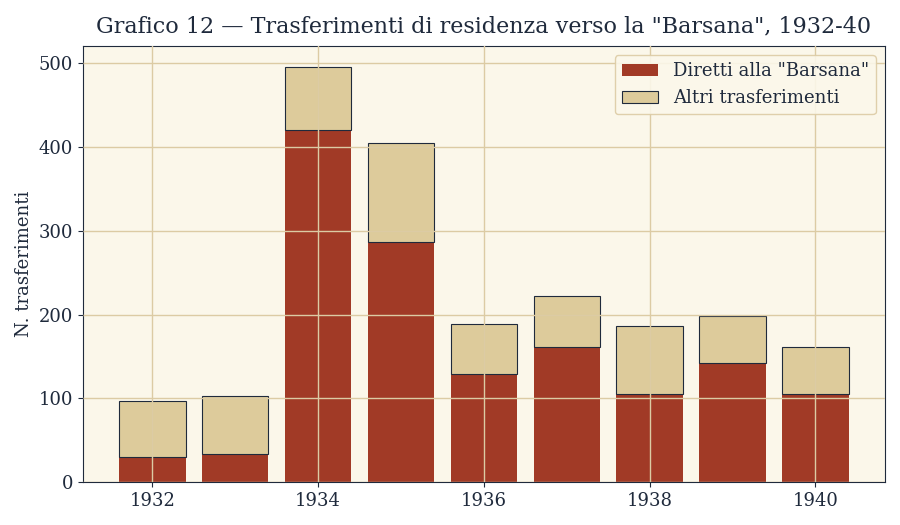
• Tab. 12 — Changes of residence outside the province and to the “Barsana” area. Source: compiled from data held in ACB, Register of Emigration Applications, 1931–39.
Chart 4 — Emigration from Bagnone — Destinations 1853–1854
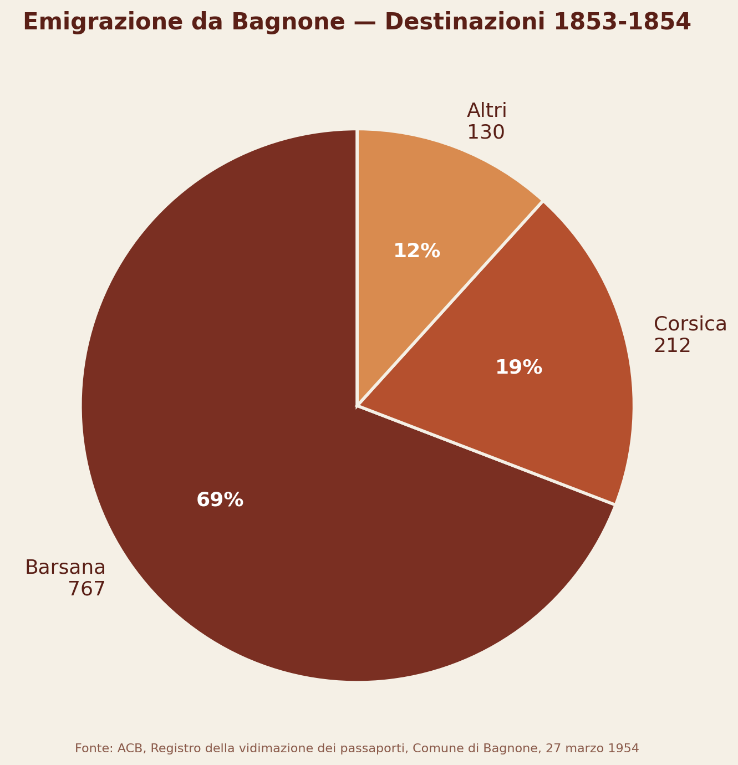
• Chart 4 — Emigration from Bagnone — Destinations. Source: ACB, Passport Validation Register, Municipality of Bagnone.
Chart 10 — Emigration from Bagnone — Transoceanic and European 1884–1915
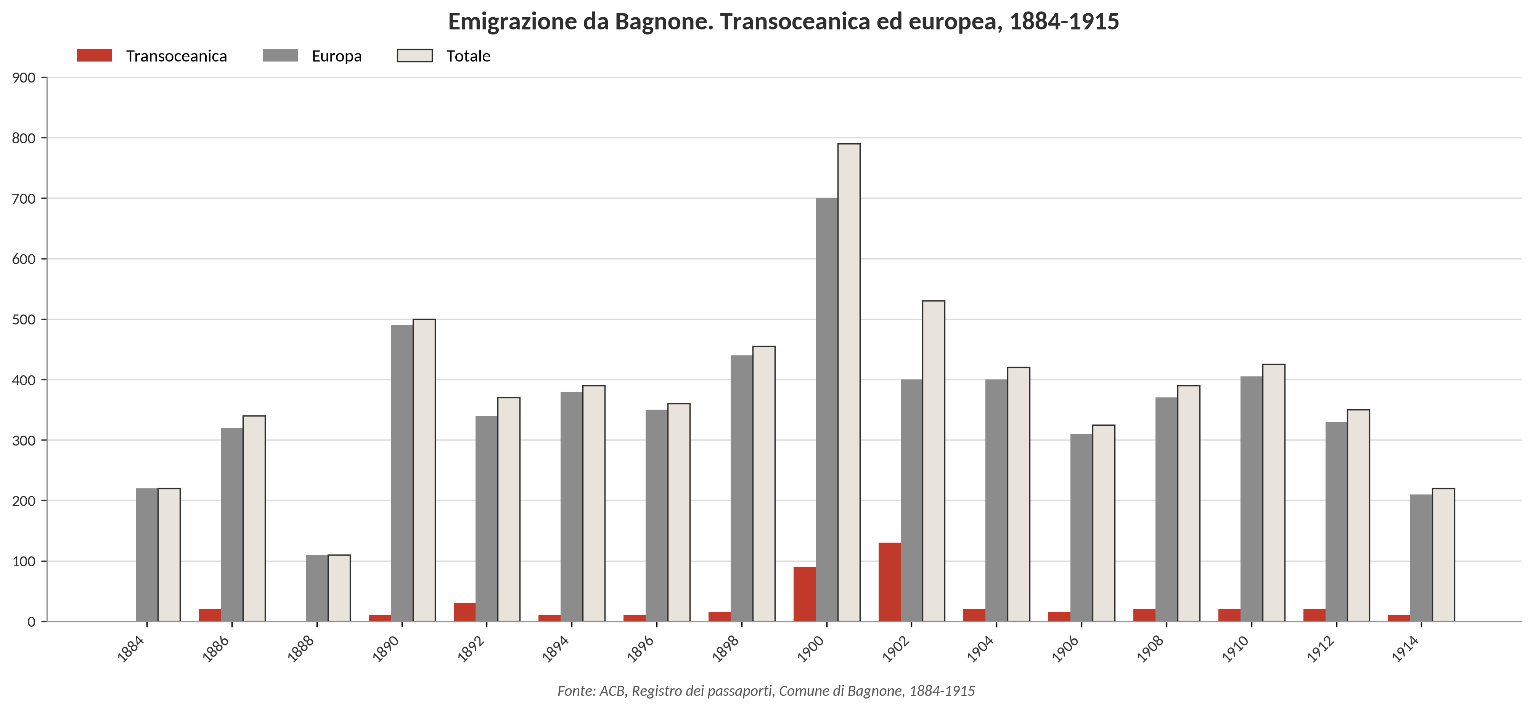
• Chart 10 — Emigration from Bagnone — Transoceanic and European. Source: ACB, Passport Register, Municipality of Bagnone, 1884–1915.
Chart 11 — Emigration from Bagnone — Destinations 1920–1924
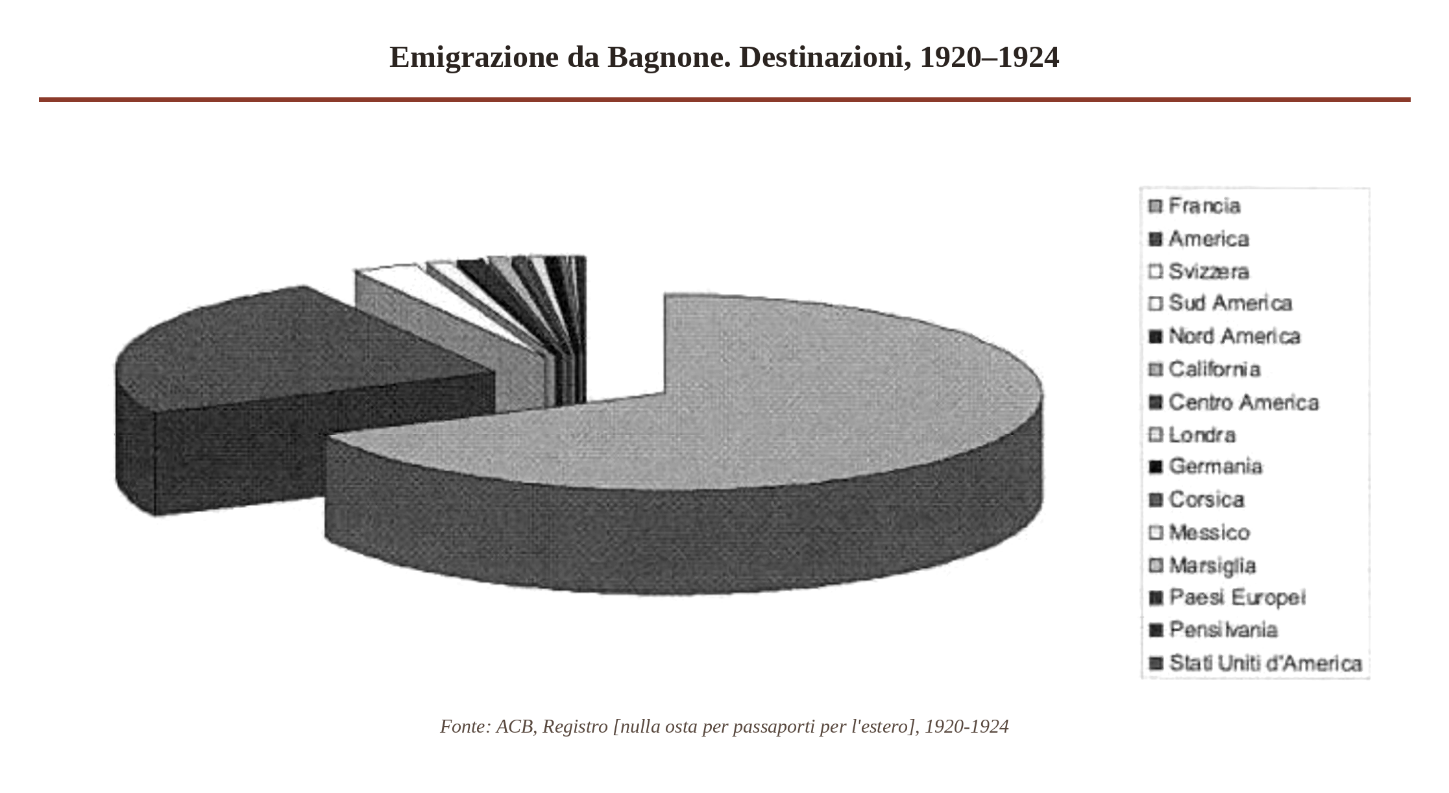
• Chart 11 — Emigration from Bagnone — Destinations: ACB, Register [clearance certificates for foreign passports], 1920–1924.
SOURCES AND CREDITS
Tables and charts reworked from the essay DADÀ, Adriana, Dalla Lunigiana alla “Barsana”. Il processo di trasformazione da lavoratori agricoli stagionali in venditori ambulanti specializzati, SIDES, “Bollettino di Demografia Storica,” 1993, no. 19, pp. 111–113.
Charts, Emigration from Bagnone 1884–1915 and 1920–24, from the presentation “I Barsan, una vita di lavoro e di ricordi,” Municipality of Bagnone, statistical data compiled by Adriana Dadà — Internal migration / emigration abroad: Bagnone, Lunigiana, 1840–1940.
TABLES
- Tab. 1 — Emigrants from Bagnone in 1812, by age. Source: compiled from data in the passport records held at the State Archive of Parma (ASP).
- Tab. 2 — Inhabitants and emigrants from Bagnone in 1849, by age group and sex. Source: from data in the register held at the State Archive of Parma (ASPa), Interior Office, folder 476. Overall migration rate for 1849: M 45.2% · F 19.4% · M+F 32.3% (out of 615 total inhabitants, 199 total emigrants).
- Tab. 3 — Inhabitants and emigrants holding free passports from Bagnone, 1849–57. Source: compiled from data held at the ASP, Prefecture of the Parma Lunigiana, Censuses 1849–59, file 1; Municipal Archive of Bagnone (ACB), 1857 Census.
- Chart 4 — Emigration from Bagnone — Destinations. Source: ACB, Passport Validation Register, Municipality of Bagnone.
- Tab. 5 — Inhabitants and emigrants holding free passports from Bagnone, by sex. Source: compiled from data held at the ASP, ACB, folder 431 — Population statistics, 1845–60.
- Tab. 6 — Inhabitants and emigrants from the hamlet of Pieve di Bagnone. Source: compiled from data held at the ASP, ACB, folder 431 — Population statistics, 1845–60; 1857 Census.
- Tab. 7 — Inhabitants and emigrants in the Parma Lunigiana. Source: reworked from data held at the State Archive of Parma, 1849–59, folder 125, file 59; 1857 Census, table II — Resident population by age and sex, Province of the Parma Lunigiana.
- Tab. 8 — Inhabitants of the municipality of Filattiera and emigrants from certain hamlets, by age. Source: compiled from data held at the Municipal Archive of Filattiera (ACF), 1857–58 Censuses, Population Registers.
- Tab. 9 — Resident and present population of Bagnone at each census. Source: compiled from ISTAT census data — Present and resident population at the censuses from 1861 to 1961; Territorial districts, 1861–1961.
- Chart 10 — Emigration from Bagnone — Transoceanic and European. Source: ACB, Passport Register, Municipality of Bagnone, 1884–1915.
- Chart 11 — Emigration from Bagnone — Destinations: ACB, Register [clearance certificates for foreign passports], 1920–1924.
- Tab. 12 — Changes of residence outside the province and to the “Barsana” area. Source: compiled from data held in ACB, Register of Emigration Applications, 1931–39.
